ELON MUSK BOMBSHELL: ‘This might be the biggest fraud in history’ … Bernie Madoff was a piker in the scheme of things!

Maybe there are vampires after all.
And they’re collecting Social Security.
That stunning conclusion comes from Elon Musk, chief of President Donald Trump’s Department of Government Efficiency, and is a result of DOGE’s initial review of the nation’s Social Security, its payouts, and more specifically, those getting the benefits.
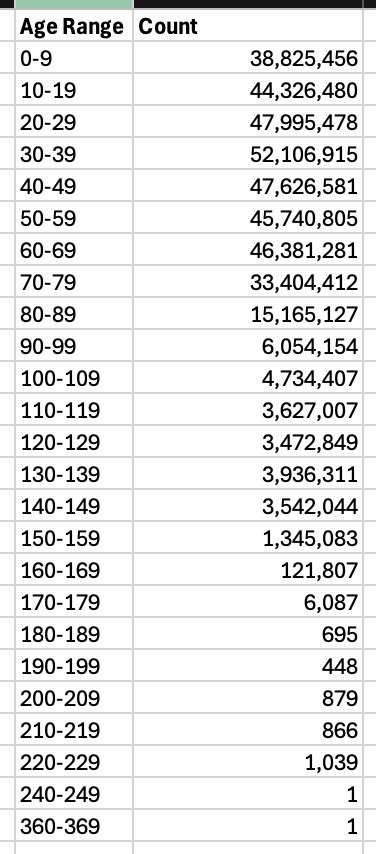
Musk posted on social media the comment, “According to the Social Security database, these are the numbers of people in each age bucket with the death field set to FALSE!”
He continued, “Maybe Twilight is real and there are a lot of vampires collecting Social Security.”
The chart, for example, lists one person each in the age range 360-369 and 240-249.
That would make those beneficiaries older than the Civil War, older than the Revolutionary War, older than the Constitution, older than … the United States, which is coming up on its 250th next year.
Musk noted that, “This might be the biggest fraud in history.”

Social media commenters suggested the impossible age scenarios have come about because illegal aliens have been using the numbers of deceased Americans.
And a comment at the Gateway Pundit explained Musk unearthed a “jaw-dropping irregularity from the U.S. Social Security database.”
“The numbers are truly mind-boggling: over 25 million Americans registered aged 100 and older, with some purportedly older than the U.S. Constitution itself.”
That report pointed, out, “As of 2024, the U.S. Census Bureau estimates that approximately 101,000 Americans are aged 100 and older, representing about 0.03% of the total U.S. population. This group, known as centenarians, is projected to more than quadruple over the next three decades, reaching around 422,000 by 2054, according to the Pew Research Center.”
The report noted there are 136 Americans considered “supercentenarians,” who are 110 or more.
‘Mind-blowing’: Trump and Musk find people ‘150 years old’ receiving Social Security payments
Feb 17, 2025 22:00 UTC (Eastern+5)
U.S. Population

Components of Population Change
| 22:00:49 UTC | |
| One birth every 9 seconds | |
| One death every 9 seconds | |
| One international migrant (net) every 21 seconds | |
| Net gain of one person every 17 seconds |
World Population
TOP 10 MOST POPULOUS COUNTRIES (July 1, 2025)
| 1. India | 1,419,316,933 | 6. Nigeria | 242,794,751 |
| 2. China | 1,407,181,209 | 7. Brazil | 221,359,387 |
| 3. United States | 342,034,432 | 8. Bangladesh | 170,183,916 |
| 4. Indonesia | 283,587,097 | 9. Russia | 140,134,279 |
| 5. Pakistan | 257,047,044 | 10. Mexico | 131,741,347 |
The United States population on February 16, 2025 was: 341,347,814
select date
Annual Population Estimates
United States Population Growth by Region
Northeast Midwest West South
United States Population by Age and Sex
Most Populous
| State | Population, 2024 | Pop. per sq. mi., 2024 |
|---|---|---|
| California | 39,431,263 | 253.0 |
| Texas | 31,290,831 | 119.8 |
| Florida | 23,372,215 | 435.6 |
| New York | 19,867,248 | 421.6 |
| Pennsylvania | 13,078,751 | 292.3 |
| Illinois | 12,710,158 | 229.0 |
| Ohio | 11,883,304 | 290.8 |
| Georgia | 11,180,878 | 193.7 |
| North Carolina | 11,046,024 | 227.2 |
| Michigan | 10,140,459 | 179.1 |
Highest Density
| State | Population, 2024 | Pop. per sq. mi., 2024 |
|---|---|---|
| District of Columbia | 702,250 | 11,488.5 |
| New Jersey | 9,500,851 | 1,291.8 |
| Rhode Island | 1,112,308 | 1,075.9 |
| Massachusetts | 7,136,171 | 914.8 |
| Connecticut | 3,675,069 | 758.9 |
| Maryland | 6,263,220 | 645.0 |
| Delaware | 1,051,917 | 539.9 |
| Florida | 23,372,215 | 435.6 |
| New York | 19,867,248 | 421.6 |
| Pennsylvania | 13,078,751 | 292.3 |
About the Population Clock and Population Estimates
U.S. Population
The U.S. population clock is based on a series of short-term projections for the resident population of the United States. This includes people whose usual residence is in the 50 states and the District of Columbia. These projections do not include members of the Armed Forces overseas, their dependents, or other U.S. citizens residing outside the United States.
The projections are based on a monthly series of population estimates starting with the April 1, 2020 resident population from the 2020 Census.
At the end of each year, a revised series of population estimates from the census date forward is used to update the short-term projections for the population clock. Once the updated series of monthly projections is completed, the daily population clock values are derived by interpolation. Within each calendar month, the daily numerical population change is assumed to be constant, subject to negligible differences caused by rounding.
Population estimates produced by the U.S. Census Bureau for the United States, states, metropolitan and micropolitan statistical areas, counties, cities, towns, as well as for Puerto Rico and its municipios can be found on the Population Estimates web page. Projections of the future population for the United States can be found on the Population Projections web page.
Cities featured on the Most Populous and Highest Density lists feature populations of 5,000 or more on July 1, 2024.
Census Bureau Economic Briefing Room
Index of Economic Activity <— click for graphs!
